4-minute read
Imagine you could predict the future. What would your prediction look like? Maybe you’d appreciate an estimate about which of your products were going to sell best over the holidays, what your revenue increase could be next Fall, or which of your machines might fail first.
As a process, decision-making is the same regardless of whether it’s personal or professional:
1. Evaluate relevant data (current and historical) and establish unknowns.
2. Brainstorm possible scenarios, next steps, and outcomes.
3. Pursue the most attractive course of action.
While no one can actually predict the future, business dashboards and analytics can help us evaluate possible scenarios, make well-informed decisions, and increase the likelihood of achieving business goals.
What is a business dashboard?
A business dashboard is an interactive, real-time summary of data from across an organization or project. It has your KPIs, charts, graphs, and filters to toggle for different views of the data.
What is predictive analytics?
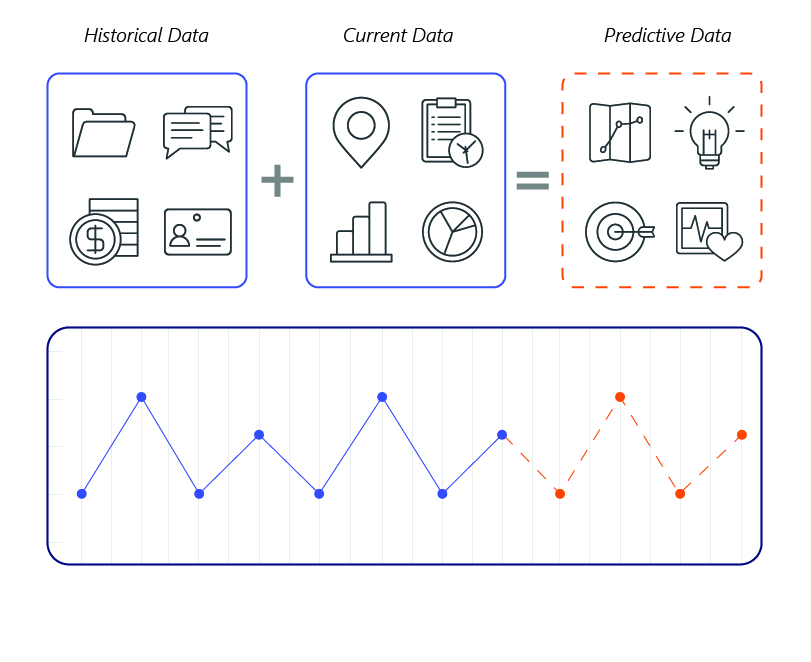
Predictive analytics is the application of machine learning algorithms on historical and current data to identify patterns and create predictive models. Many types of data are viable for this type of analytics, primarily databases and/or flat files.
When predictive models have been created, they are used to estimate future data points, which are then integrated into dashboards and/or reports. These give a “best-guess glimpse” into what may occur in the future, allowing stakeholders to plan more carefully and adjust behaviors and processes to align better with their goals. In short, predictive analytics is an educated guess displayed in visual format.

Data in predictive analytics can be presented in any format that illustrates an answer to the question it relates to. Common formats include:
• Bar graph
• Line graph
• Bubble graph
• Scatter plot
• Map graph (choropleth map)
• KPI %
How predictions can improve a data story
As mentioned in my previous article about storytelling with data, while insights within your data are numerous and robust, they are useful only if you understand your data. One way to do this is using a data story. Where has your company or project been? Where is it now? Where do you see it going?
With the help of machine learning algorithms and predictive modeling, the question of what to expect becomes easier to answer. Instead of simply reviewing the past and present, your data story extends into the future, guiding you in the right direction.
Examples of predictive analytics by industry
Predictive analytics can be helpful in a wide variety of industries. Examples include:
Insurance
• Analyze current claims trends and transform processes
• Identify customers at risk of cancellation
Education (Both K12 and Higher-Ed)
• Prevention of high school student dropouts
• Reduction of monthly operations cost after implementation of grant
Healthcare
• Estimated increase in patient wait time during holiday periods
• Profiling of patient care required based on specific diagnosis
Manufacturing/Logistics
• Preventative maintenance in Industry 4.0
• Estimate production volume per month
Marketing
• Expected conversion rate of a campaign
• Anticipated follower count on certain date
Non-profit
• Estimated increase in donations based on increased event frequency
• Estimated attendance of annual event
Retail
• Optimal scheduling of holiday inventory
• Most lucrative pairing of sale items
While actual events are always susceptible to unexpected influences, insights gained from data-based predictions can influence behavior and provide a framework for businesses to make powerful changes. They can also help users learn how to tell a story with data.
Like what you see?

Nick Kelly is the Director of Visual Analytics at Logic20/20. He is a hands-on leader in analytics with over 16 years of international experience in analytics and software development, deployment, adoption, and user experience.

