Visual Analytics
So much data, so little time
How visual analytics cuts through the noise and turns data into a strategic asset.
For most organizations, lack of data is not a problem: 24 hours a day, 7 days a week, terabytes of data are zooming through their servers at the speed of light. All that data could be put to use creating value for the business … or it could just sit there, taking up server space.
Data-savvy organizations know that if data is to deliver real business value, it needs to fill four criteria:
-
-
- It has to be clean and reliable.
- It has to answer the right questions.
- It has to be easy to translate into action.
- People have to want to use it.
-
At Logic20/20, we bring together the necessary elements to put your data to work delivering results.
VISUAL ANALYTICS: 3 KEYS TO DATA-DRIVEN DECISIONS
By adopting visual analytics with a three-front approach that addresses data, tools, and people, you can bridge the gap between your data and the decisions that can boost your bottom line.

Key #1: Analytics strategy
Even the world’s best data—and the best reporting tool—will do you little good if it’s not answering the right questions that lead to real-world business results.
A well-designed, well-executed analytics strategy will help you optimize all that raw data so that it can deliver insights for strategic decision making.

Key #2: User experience
It’s also vital to ensure that those insights are easy for business users to understand and to translate into action. Sites like Amazon and Wikipedia have raised the bar for user experience, even in business applications.
People expect to be served with exactly the information they need, exactly when they need it, in a format that’s instantly usable for driving decisions … or else that shiny new analytics tool will sit around gathering dust.

Key #3: Change management
Evolving into a data-driven organization requires fundamental change across multiple departments. Rolling out a BI application with a few off-the-shelf training sessions is not enough.
If your business is going to put its data to work, people must want to use data in driving decisions, and that cultural shift requires a well-thought-out and mindfully implemented change management strategy.
FEATURED PROJECT
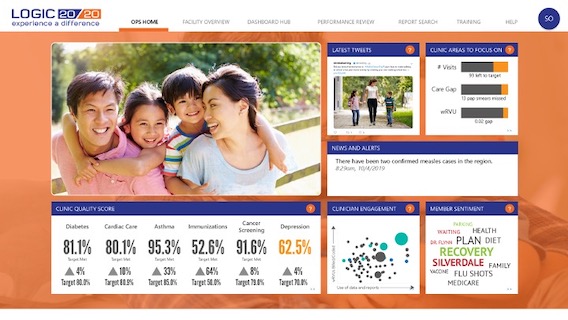
How visual analytics can streamline medical practice managment
Find out how we helped a multi-specialty medical group save over 1,000 hours per year with user-customized analytics dashboards.


WHITE PAPER
Data literacy: top-down and bottom-up strategies for creating a data-literate organization
For data-centric behaviors and beliefs to take hold in an organization, they must be communicated, and therefore a common language for talking about data must be in place. In other words, to build a data culture—the foundation for a data-driven organization—data literacy is a foundational requirement. Learn the fundamentals for building a data-literate organization from the top down and from the bottom up.
Practice Area Leads

Mick Wagner
Experienced analytics leader helping teams succeed with data lifecycle strategy, solution architecture, data management, and more.

Adam Cornille
Data science leader and practitioner with over a decade of experience in development, statistics, and management practices.
Need help with your advanced analytics?
Just fill out the connect form and we’ll be in touch.
