We helped a multi-specialty medical group save over 1,000 hours per year on physician and clinic performance oversight with user-customized analytics dashboards.
At a glance
For a large West Coast–based medical group, the manual approach of gathering data to track physician and clinic performance was consuming hundreds of hours per quarter. They needed a better way, and that’s why they contacted us.
Customer challenge
Our client had been tracking physician and clinic performance through a patchwork of one-off dashboards and reports, and accessing the necessary data to track performance was tedious and time-consuming for stakeholders at all levels:
• On the strategic level, regional executives were spending hours each week emailing back and forth with clinics to ask about their numbers.
• On the operational level, physician leaders had to access multiple dashboards and reports to access the information they needed to compile performance reviews.
• On the tactical level, individual physicians were frustrated with hard-to-navigate platforms that made it difficult to assess what was happening within their own practices.
Approach and solution
After meeting with dozens of stakeholders, we designated five user personas across all three levels—strategic, operational, and tactical. We then documented the specific needs and frustrations of each persona to ensure that the end result would deliver the best possible experience for every user at every level.
We designed an analytics hub that offers views from the client’s existing dashboards in a single location. To help users get the most out of their experience, we embedded tutorial visuals and a virtual assistant. Users at each of the three levels have tailored home screens providing the data they need to make informed decisions, eliminating the need to wade through irrelevant information.
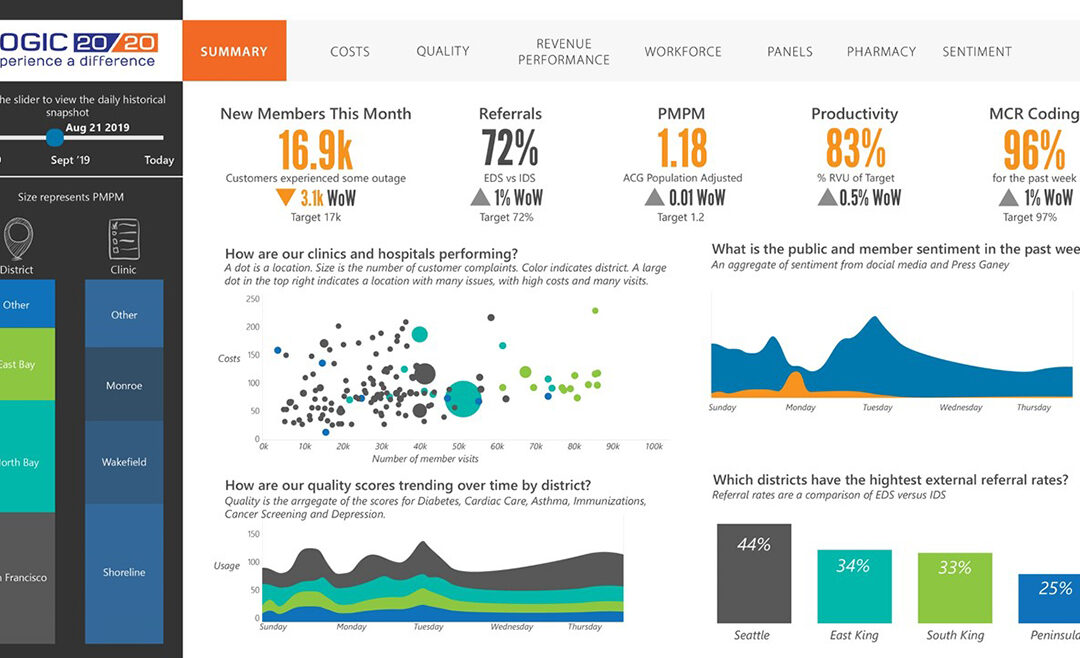
Executives at the strategic level can view KPIs for the system as a whole and drill down to specific regions and clinics.
Physician leaders on the operational level can access practice-specific quality scores for their clinics, areas that require attention, and other KPIs.
Individual physicians on the tactical level can view their own quality scores benchmarked against those of their peers and access specific reports, training resources, and more
Value and benefits: "The Wins"
Our client’s new analytics hub lets decision makers quickly access the information they need to make informed decisions, freeing up time to focus on their mission of serving patients.
-
1,000 hours/year. Solution saved 1,000 hours/year by eliminating the need to hunt for information and delivering the data they need to enable continuous performance improvement.
-
75%. Instead of taking 4 hours to compile each physician’s quarterly review, physician leaders can now complete the job in one hour.
-
2+ hours/week. Executives save the 2+ hours per week they used to spend emailing back and forth with clinics about their numbers.
Physicians are able to better understand their data and see how this understanding gives them a stronger voice in the review process.