4-minute read
Snapshot
When the small-business division of an Australian telecom enterprise set a goal of implementing simple, self-service reporting for their channel sales team, they contacted Logic20/20. We replaced their weekly 40-page PDF reporting document with interactive Tableau dashboards to support their channel performance assessment meetings and ongoing executive oversight. The results: dramatically increased user adoption, greater ROI on their Tableau investment, and enhanced data-driven decision making at all levels.
We brought our expertise and experience in:
- Tableau
- Microsoft SQL Server
- Lavastorm Analytics
Building connections across Australia—and around the world
One of Australia’s leading telecommunication and information services companies, our client has been a pioneer in the industry for decades. Today, they provide more than 22 million retail mobile services and over 3 million retail bundle and data services for customers in Australia. They also operate in more than 20 other countries, including the United States, serving thousands of business, government, carrier, and OTT customers.The company had invested in Tableau, but current reporting was static and not designed to answer business performance questions or inform action.
Encountering challenges in data utilization
The leader of an Australian telecom’s small-business division wanted to improve his organization’s use of data in driving discussions about their sales channels’ performance. The company had invested in Tableau, but current reporting was static and not designed to answer business performance questions or inform action.
Before each weekly performance meeting, channel managers were often rummaging through the performance report—a 40-page PDF document—to locate their information, often requiring the help of an analyst. Leadership was growing frustrated, as each root-cause analysis question took days or weeks to answer.
Addressing next logical questions for improving channel performance
We began our engagement with a deep dive into the specific problems that our solutions would be designed to solve—questions such as “How will this solution be used in weekly performance meetings?” and “Which high-value business questions will these dashboards answer?” These discussions also presented an opportunity to understand the end users, their needs, and their preferences.
Next, we delved into the data sources behind their sales reporting. To serve their reporting needs, they had built an analytics cube—a multidimensional data source that was pre-aggregated and organized into a hierarchical structure—in SSAS (SQL Server Analysis Services). The challenge with cubes is that they limit the possibilities in creating new Tableau models that integrate other relevant datasets. Our team used code to “flatten” the cube, thus treating the data as a database connection to enable a flexible data model. This flexibility enabled us to create a semi-automated data refresh process, which made it easy to incorporate new data or to revert to a previous version if a problem were to arise.

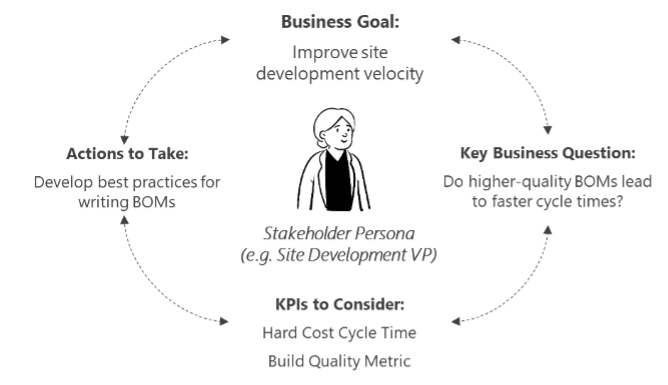
Scenario-driven, data-driven decision loop
Driving insights to dashboards
Our team built seven interactive Tableau dashboards to support the client’s performance meetings. For the first time, the head of the division could view the current state of his nine critical KPIs connected to overall business performance and associated trends to focus his discussions with individual channel leaders. Channel-level reporting revealed insights such as week-over-week revenue changes, most popular products, historical trends (e.g. year-over-year changes), and comparisons with the highest- and lowest-performing channels.
Sample executive drill-down suite—KPIs, KPI performance trends, channel performance
(intentionally blurred with mock data)
Targeted sales conversations, powered by data
Upon completion of the project, our client had confidence in his data and supporting tools to drive data-informed sales discussions with his channel managers to improve performance. The reporting platform required minimal management and was capable of addressing future business changes. The team also dramatically increased the return on their Tableau investment by tapping into the full potential of the platform.
Building a data-driven sales organization
The reporting system our team built enables our client to advance towards their goal of becoming a data-driven organization. Today, they are able to practice proactive performance management, and sales leaders are becoming more comfortable incorporating data into their daily routines. And when the weekly performance meetings roll around, every channel manager has exactly the insights they need to share best practices and customer trends.

Put your data to work
- Data strategy
- Data science
- Data engineering
- Visual analytics


