As the volume, velocity, and variety of enterprise data increases on a daily basis, most business leaders would agree that data literacy is a key competency that impacts their competitive advantage. Yet few enterprises have achieved the level of data literacy that can help them build a culture where data-driven decision making reigns supreme. In a recent survey, only 26 percent of business decision makers said that everyone in their business is proficient in reading, working with, analyzing, and arguing with data.
There are many reasons why this is the case, and few are more prevalent than these top five:
- Low trust in data
- Not creating real value for users
- Poor historical adoption of reports and dashboards
- Being reactive to requests
- No single place to look
You may be able to relate to some or all of these, but what is notable is that none of them are about data quality, the age-old reason given in the past for BI failure. Now the difference between success and failure lies with people—understanding their needs, customizing their experience, and ensuring they have the cognitive foundation to use data strategically, which starts with data literacy.
Fortunately, the following five steps can help any organization—regardless of size, industry, or employees’ current skill levels—begin building a data literacy program that can form the foundation of a data-driven culture.
1. Assess your team
Before you can plan for the future of data literacy in your organization, it’s vital to know where you stand today, and that starts with an assessment of your people. Find out where each data user (current or potential) stands, not only in terms of data skills and knowledge, but also their comfort level in working with data and their confidence in the data they have available. Remember to include non-technical skills such as critical thinking and communication, which are also key characteristics of a data-literate individual.
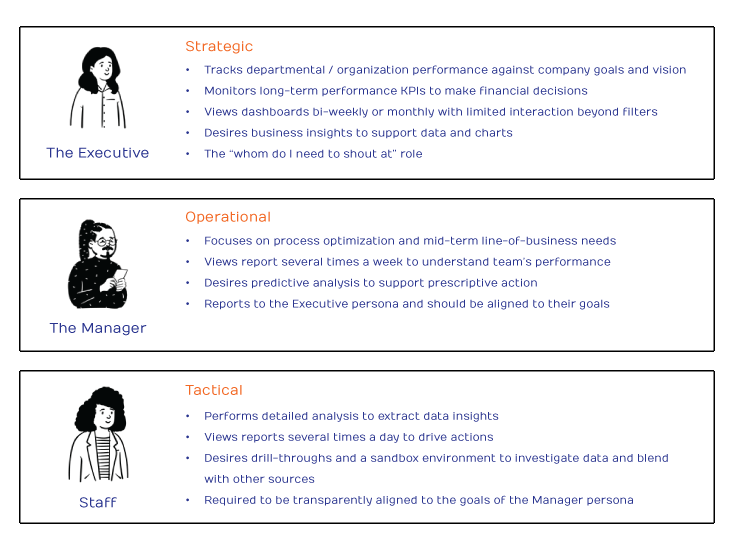
As you review the results of your assessments, you’ll notice categories of users begin to emerge, each characterized by a unique set of needs and expectations. Creating personas to represent each of these categories and incorporating them into your planning will help you build a data literacy program that serves a broad range of employees and increases your chances of success.
Personas will vary from organization to organization. You may find it helpful to distinguish your users in terms of their level in the organization and how they will use the data, for example (click image for larger view):
2. Develop a change plan
A successful data literacy program involves numerous moving parts.
- You need to gain leadership buy-in.
- You need a communications plan.
- You need to train your people.
- You need to measure the results and plan for continuous improvement.
The list goes on. If you try to tackle these elements all at once, you could be sabotaging your chances of success.
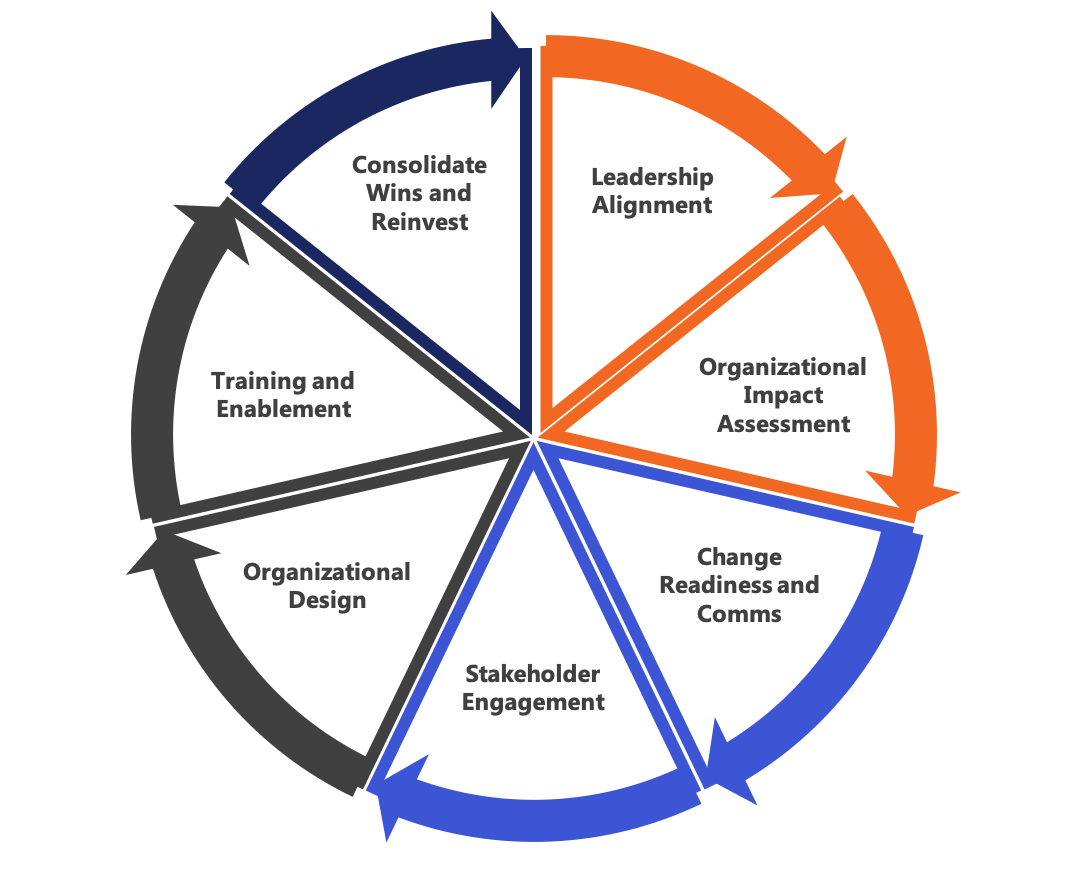
That’s why it’s important to build a plan for the steps needed to create and implement your data literacy program. Notice that our plan graphic below is circular, emphasizing the ongoing cycle of implementation, assessment, improvement, and reiteration.
While this approach may seem somewhat novel in analytics and BI, it is a well-established part of change management methodologies.
3. Define a tactical process for insight delivery
If Step 2 was the “big picture” step, Step 3 is where you “get granular” and sketch out the implementation of your data literacy program. We divide this process into three parts:
1. Requirements gathering: Understanding what your data users need, what they want to accomplish
2. Vision: Determining and aligning on what the end result will look like
3. Launch and adoption: Developing the program, implementing it, and measuring the results
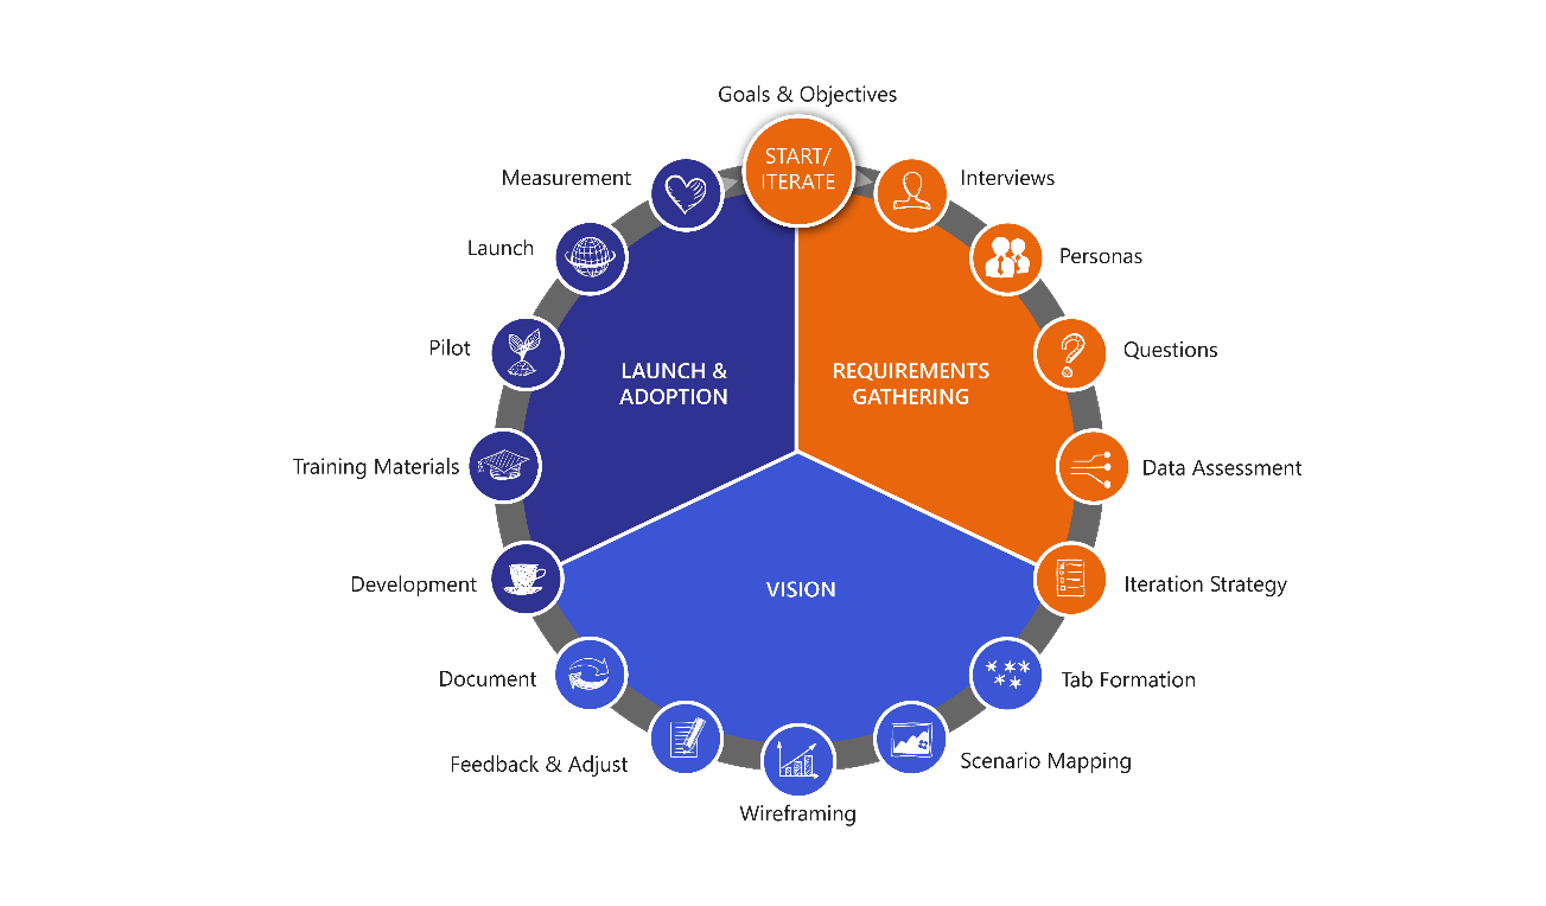
(click image for larger view)
4. Plan multiple iterations
Once you define your process, remember that no single iteration will get you to your ultimate data literacy goals. Instead of grand leaps, think baby steps.
Chances are you’ll have to reiterate your tactical process (see Step 3) several times before you achieve your desired levels of data literacy and begin to see real results in terms of data-driven decision making. The good news is that you don’t have to get everything right in your first iteration. Just as your learners grow and evolve over time, your process is also on a journey of continuous improvement as you learn what works (and what doesn’t) for your data, your users, and your organization and make adjustments accordingly.
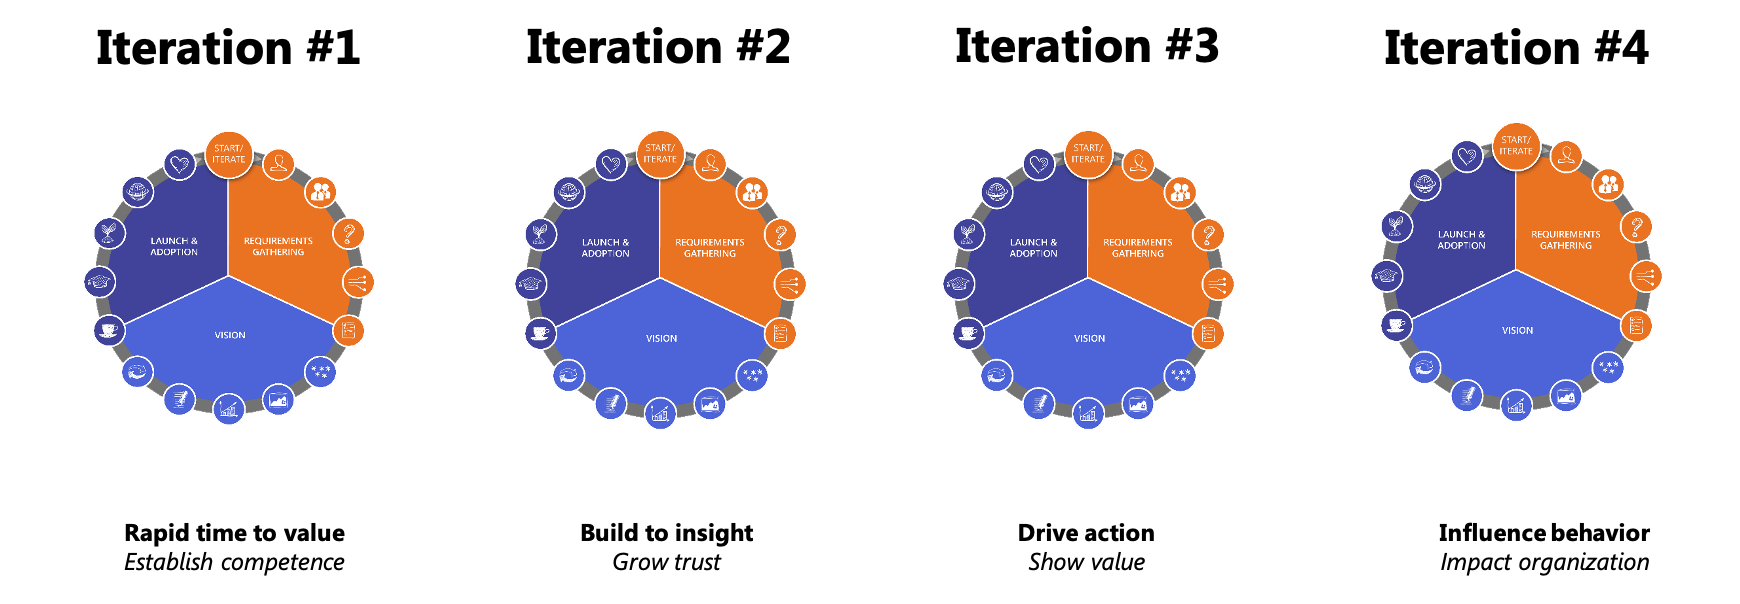
(click image for larger view)
5. Embed continuous learning opportunities
Your data is always changing, as are your customers, your business environment, your technologies, etc. If your users are to maintain a desired level of data literacy, ongoing learning is vital. Make it easy and intuitive for your users to continue learning by embedding educational opportunities into an analytics hub.
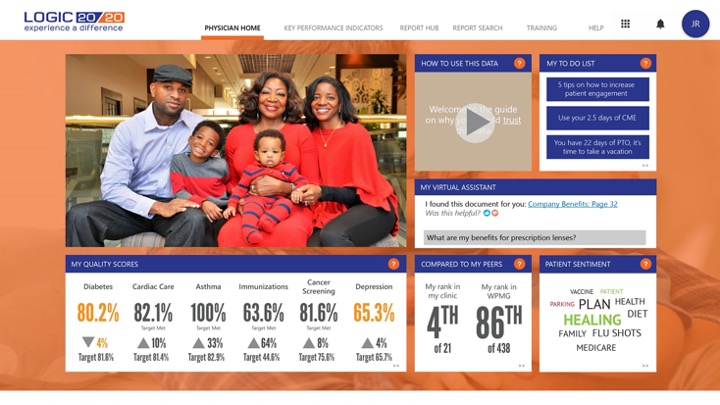
Your approach to embedding learning into your analytics hub will depend your organization and the preferences of your users. Here are just a few proven approaches you may want to consider:
- Training videos embedded directly into the interface, alongside the user’s favorite dashboards (as in the example above)
- Scroll-over popups that offer insights on specific fields
- “Learn more” links that connect to tutorials
- Contact information for SMEs who can answer questions
The goal is to spark curiosity in your users and make it easy for them to expand their knowledge.
I like to think of data literacy as the “license” needed to “drive” data analytics. Just as a Ferrari is useless without a driver’s license, even the most advanced analytics platforms will do your organization little good without educated users who know how to evaluate and use the information presented to them. By taking the five steps I’ve presented above and planning for continuous reiteration and improvement, you can set your users on the path to becoming savvy data consumers and begin building the foundation for a truly data-driven culture.
This article is the second in a three-part series on data literacy. You can read Part 1, “Data literacy: Overcoming the ‘so what’ objection,” here.

Empower employees with data literacy
Logic20/20 applies our proven change management process to ensure alignment among leaders, stakeholders, and users in designing and executing effective data literacy programs.
- Strategic vision of data culture
- Initial assessment
- User adoption
- Continuous improvement

Nick Kelly is the Director of Visual Analytics at Logic20/20. He is a hands-on leader in analytics with over 16 years of international experience in analytics and software development, deployment, adoption, and user experience.

