Businesses today are surrounded by an overwhelming amount of data. Many companies put significant effort into analyzing and drawing conclusions from their data, but do not see the impact they seek or are unable to harness it to its full potential. Others are overwhelmed by the volume of data at their disposal, wary that the outputs of labor-intensive data-sifting will not be worth the time and effort it takes to get there.
Businesses that are able to successfully draw meaningful and actionable insights from their data typically come across these steps in their BI customer journey.
Asking the right questions
It’s easy to get excited about things like data modeling and machine learning, but businesses should be careful not to short-change the effort of problem framing. Before throwing commonly used metrics on a dashboard, businesses need to spend time creating a clear vision of the problems they are trying to solve in their organization and how the data can help guide decision-making. Data modeling and machine learning are nothing without the vision and strategy for how to extract the insights that mean most to your business and apply them in a functional way.
A good business intelligence strategy begins with defining what problem a company wants to solve. This often looks like a brainstorming session to talk about current business challenges, who needs information, and what information or data you would need to solve those challenges. Once we know that we are asking the right questions, we can look toward the available data to support the answers we need.
Strong data governance to support BI and analytics
At this point, many organizations run into difficulty working with their data efficiently. They find the data isn’t organized or structured well so it’s cumbersome to work with even after they know what they want to use it for. At this point data management and governance come into play, they are an essential factor in data strategy and the ability to scale.
In some instances, data is stored in a data warehouse without a clear idea of its capabilities. In others, it may be segmented in several locations and/or formats across the organization. These factors can make the information difficult to mobilize. As the volume of data grows, good data management becomes increasingly necessary.
Start with an inventory of data sources and types. Prepping and cleaning data can be an extremely time-consuming and frustrating process. Enforcing data governance best practices and making use of tools can significantly reduce the effort involved in this stage. Once you confirm the required data is available and accessible, it’s important to make it usable and trackable. Adopting a cloud solution can be a great first step to creating a strong data governance strategy.
Advanced analytics reveals the story of your data
With the data prepared for analyses, data scientists now use statistical models and techniques to provide deeper insights into your business and your customer. While each data science project is focused on answering a particular business question, collectively, they tell you a larger story about the business. These insights empower you to make data-informed decisions.
Machine learning and BI
Today, part of the journey through business intelligence can include artificial intelligence, specifically machine learning. Machine learning can be used to create statistical representations of data; in this process, the algorithm is “trained” by looking at vast amounts of data which it uses to find connections, predict outcomes, and even make suggestions.
Machine learning is about training a computer to look for patterns to improve future performance based on prior knowledge. Machine learning is more robust with large dataset to create the right model.
Designing dashboards that inform and influence
Now that we have used powerful tools to analyze and draw insights from the data, we need to present it in a way that is consumable and can help tell the story of the business and enable organizational change..
Monitoring and tracking key areas is extremely helpful to any organization. Once an organization has its statistical data, it needs a way to visually present it. A dashboard layout must be simple, easy to understand, easy to use, and tell you what is happening at a glance. .
In designing a dashboard, it’s easy to be distracted with all the options and the amount information to show. The key is to go back to the initial problem for the organization and design a dashboard to address that question.
A good dashboard is useful for both the technical and non-technical user. This way, it can provide the desired information and help to influence decisions.
Breaking down the BI customer model

In a comprehensive business intelligence approach, we can use a combination of traditional analytics and machine learning to do four things: descriptive analytics, predictive analytics, discovery analytics, and prescriptive analytics.
Descriptive analytics
• Tells us what has happened in the past and what is happening now
• Shows the factors that contributed to what has happened
Predictive analytics
• Tells us what is likely to happen based on the historical and current data
• Can create automated business forecasting reports
Using descriptive and predictive analytics, a company can create dashboards and build reports. For many organizations doing this much analysis is enough to address their immediate concerns and can be built upon at a later stage.
Discovery analytics
• Tells us what correlations exist
• Creates a model that will dig through the data and look for interesting and important patterns
Data can be sifted through today in ways that were not even available a few years ago. This is where the power of machine learning really comes into play. With so much data out there, it would take a team of people months or years to go through and find correlations. And they still may not be able to see all the factors in the way an algorithm can.
Which brings us to the last step:
Prescriptive analytics
• Tells us what the options are
• A prescriptive analytics model takes the initial question or problem and – using all the gathered descriptive data, the predictions, and the discovered patterns – develops a suggested approach
In practice: Corona Norco
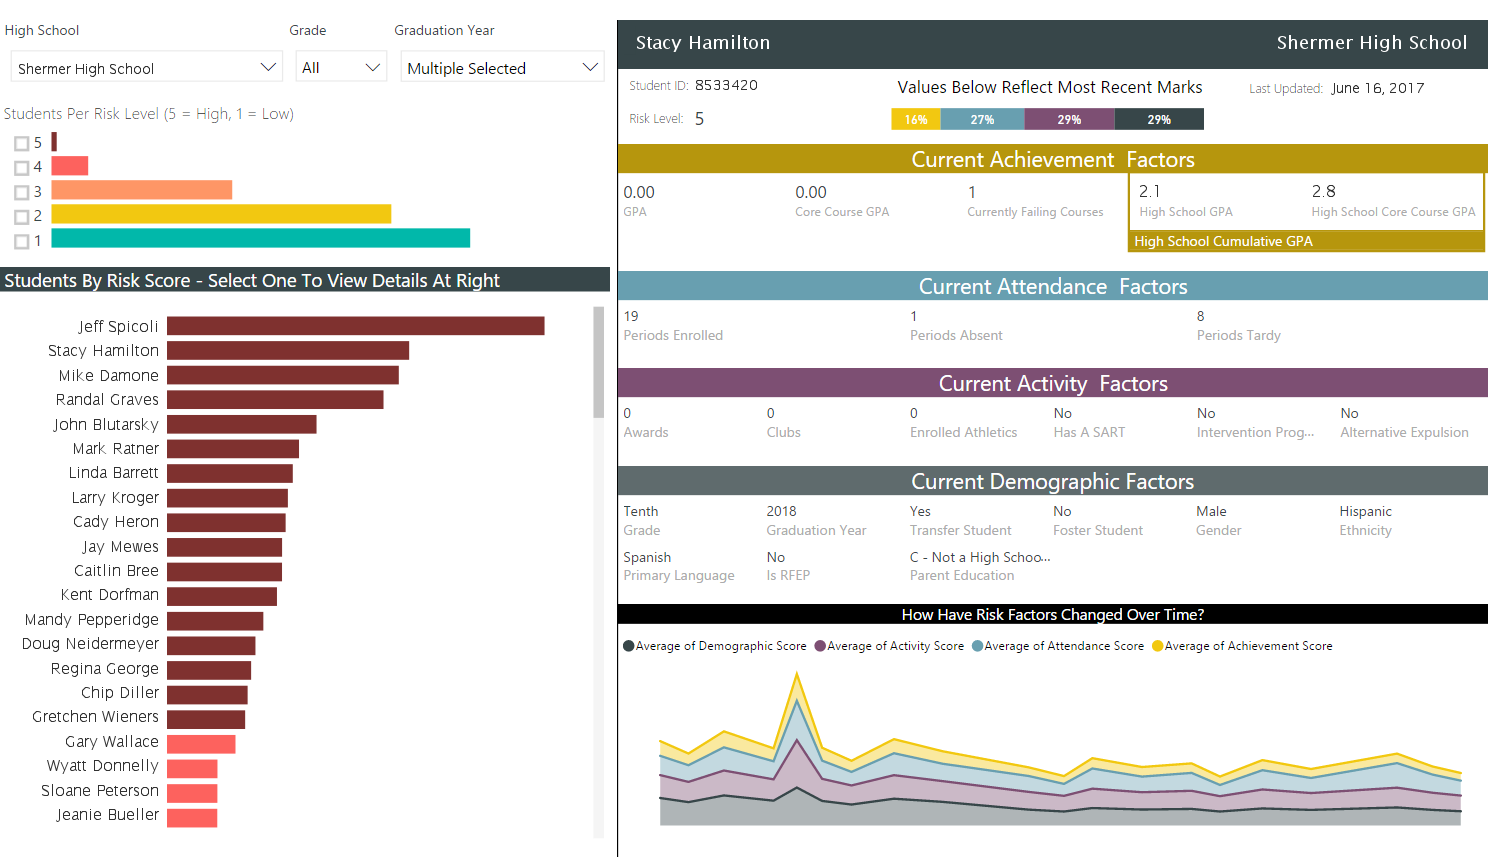
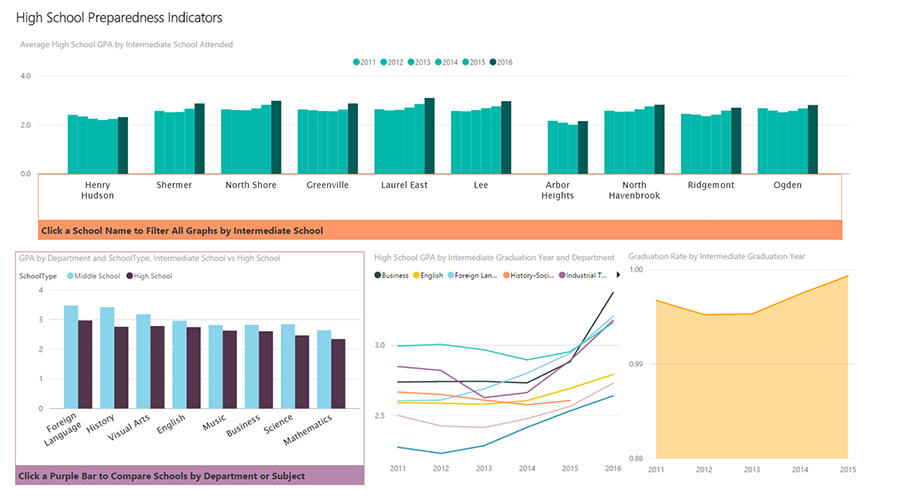
Logic20/20 technology consultants recently partnered with the Corona Norco Unified School District in California to identify students at risk of dropping out. If they knew which students were at-risk, they could intelligently direct resources toward supporting those students early on and reduce the chance of them leaving school. The school district had extensive amounts of data that would support the team in creating a solution.
First, Logic20/20 worked with Corona Norco on the specifics of their goal. Here, the goal for the school district was to identify which students were at risk of dropping out even before they entered high school, in other words: a predictive model, which we’ll take a better look at below. Based on this premise, the Logic team built a statistical model using machine learning that identified specific students at risk, recognize contributing factors, and analyze itself for accuracy.
In this example, Logic20/20 used descriptive, predictive, and prescriptive analytics to support Corona Norco in reducing drop-outs.
The descriptive statistical model created by Logic was able to use Corona Norco’s data to confirm the number of students who have dropped out of school and identify causes. From here we wanted to see what was likely to happen in the future.
The predictive analytics model could predict which students are at risk of dropping out. With this information, the school district could reach out to those at-risk students.
The model also provided analysis to help the school district track the drop-out rate. The model not only illustrated what factors contribute to the chances of a student dropping out but broke them down to individual ratings for how much each factor correlated to that chance. The model produced a probability score (0 – 1), which was converted to a 1-5 risk level for each student.
The model the Logic team developed generates revised predictions daily per-student. It also gives insights into program performance for how well each school in the district is doing at meeting their goals. It predicts the likelihood of an at-risk student dropping out with a 98% accuracy.

The deployment of the machine learning model at the Corona Norco school district was very successful. It included automated re-training models and reporting. And it was managed in Microsoft SQL Server with MS Machine Learning Services. The entire process for planning, creating, and implementing the project took just six weeks and is now maintained by the school district’s own IT staff.
In practice: YMCA of Seattle
In another instance, Logic20/20 worked with YMCA of Seattle to improve their ability to use their organization-wide data and relate it to the core business. Logic20/20 helped the YMCA update their analytics infrastructure to support their business operations, consolidate their data, and aid their fundraising efforts.
Using Microsoft Azure, Logic20/20 developed a scalable, customized, and unified data warehouse in the cloud. Once the data was consolidated from the multiple on-premises systems, it showed a clear picture of the current state of their fundraising (descriptive analytics). The dataset for YMCA included membership history, attendance, activities, donation history, and financials.
Using this data, the model predicted which members would be more likely to make additional donations, giving the organization a better forecast of their financial expectations (predictive analytics). By having a more accurate idea of what their budget would be, they could plan better and adjust if needed.
By having a more accurate idea of what their budget would be, they could plan better and adjust if needed.
The model was also able to help increase donations. And they now have a system in place that generates leads and automatically produces fundraising pledge cards, sending them to the members who are most likely to donate. Another practical outcome is that YMCA has an integrated data system able to generate dashboards and real-time reports.
Organizations ultimately want to improve and expand their business, and the BI journey is different for every establishment. The key to a successful business intelligence strategy starts before you look at any data or technologies. It starts with asking the right questions. From there, data governance provides a strong foundation to support BI and analytics where descriptive analytics and the more advanced machine learning statistical models can come into play. Finally, thoughtful data visualization and dashboard development enable communication and action.
Does your business have a problem that could be solved with business intelligence? Logic20/20’s business and technology consulting teams can work with you to identify your business’ unique challenges and develop a plan to address them.

