6-minute read
There’s a problem in healthcare—and it was here before the coronavirus outbreak.
In a Medical Economics survey, 73 percent of physicians said they experienced burnout symptoms that made them want to quit practicing medicine. The largest contributors to this feeling have little to do with treating patients. “Too much paperwork” was the No. 1 response (37 percent), with electronic health records (EHR’s) ranking No. 3 at 17 percent.
Clinicians are clearly struggling under the weight of administrative burdens, and it’s not just them. Chiefs of staff, HR and compliance directors, you name it—disparate systems and disorganized tools create an administrative nightmare, preventing them from working efficiently to give patients the best possible care.
How did we get here? How can we make technology work for our healthcare providers and return to quality healthcare that serves the needs of patients, providers, and communities at large?
A closer look at the problem
The root of this struggle is no different from the one faced by many modern organizations: legacy systems and processes filled with inaccurate, disorganized, and siloed data. Reports are sourced from multiple places for different people—sometimes manually, which can require hundreds of hours of work per year. Regardless of how they’re created, these reports play an important role in key meetings—until stakeholders realize they’re working with the wrong information. In addition to being costly and frustrating, over time, this problem compounds to create a dissatisfied workforce that’s running fast but going nowhere.
While these repercussions matter in any industry, in healthcare, they directly affect the health of real people. Patients, clinicians, clinical operations directors, medical HR/compliance directors, and more all need easy access to reliable data to make important decisions.
Patient experience and clinician experience are closely intertwined. To access patient data, clinicians must use multiple programs, interfaces, file types, and logins. Data is scattered and unreliable, sometimes updated inconsistently in two different places. The internal system isn’t much better; clinician performance, and by extension, departmental and overall clinic performance, aren’t monitored or evaluated efficiently.
Getting organized with an analytics portal
An analytics portal unifies healthcare information from across a clinic or hospital network into one simple, secure tool. Our process of creating a portal is interactive and thorough, comprising four phases:
1. Discover
We host a workshop for members of a healthcare organization to interview stakeholders and learn more about future users of the portal, understand associated processes, and develop personas that fully encapsulate relevant needs and wants. We also focus on data quality and availability by investigating the organization’s data to understand all sources, types, and uses.
2. Analyze
Next, we revisit each persona to add more detail based on the organization’s specific needs. We also work closely with stakeholders to include features that will increase analytics portal adoption within their healthcare organization.
3. Create
After gathering all requirements and understanding how the tool will be used, our team carefully designs a healthcare analytics portal that serves the needs of our healthcare stakeholders.
4. Iterate
The analytics portal evolves in cycles, changing to accommodate and improve upon new data.
Key results: A problem solved
With an analytics portal in place, healthcare staff will quickly see a range of benefits:
- Better data visibility. With carefully designed KPI’s and charts, staff can get the information they need at a glance.
- More confidence in reports. Reporting is reliable and streamlined, so delivering key information to heads of hospital and executive-level team members is easy. You’ll be using the right information in the right ways.
- Increased staff engagement. Using an analytics portal involves comments, ratings, and other social interaction. The portal isn’t just about data, spreadsheets, and KPIs—it’s a community-driven space for conversation and improvement.
- Streamlined feedback. With an easy way to access information, chiefs of staff can review clinician progress and provide detailed feedback. This isn’t just a one-time exchange at a semi-annual or annual review; instead, feedback is built into the ongoing experience of using the portal. It’s easy for chiefs of staff or HR directors to add feedback, so clinicians get personalized, ongoing input to help inform their behavior. There are no more ugly surprises—and success can be celebrated as it should be.
- More time for what’s important. Instead of it taking 10 clicks to get to something that’s sort of what you need, you spend less time getting to the right information. Busy work is reduced.
Success story: Creating a single source of KPI analytics
A regional managed care consortium came to us with a common problem: too much data and not enough information. Data was flowing in from all areas of the organization, but there was no easy way to use it for strategic decision making. One-off dashboards had been created over the years, which only added to decision makers’ frustration, as they often needed to consult seven, eight, or even nine dashboards just to understand what was going on.
After meeting with dozens of stakeholders, we designated five user personas on three levels:
- Strategic (executives)
- Operational (physician leaders)
- Tactical (junior and senior physicians)
We then performed a deep dive on the specific needs and frustrations of each persona to ensure that the finished product would deliver the best possible experience.
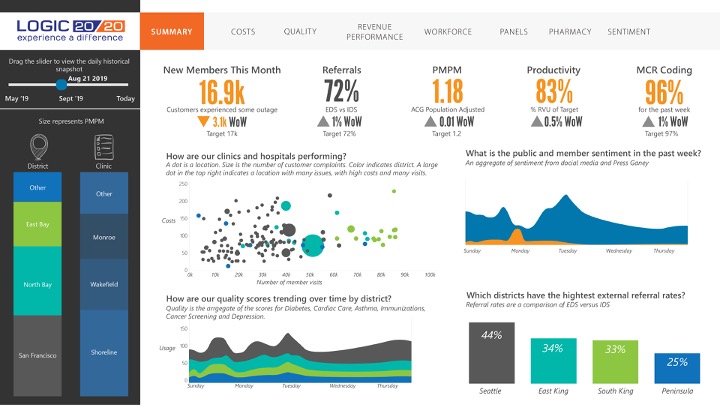
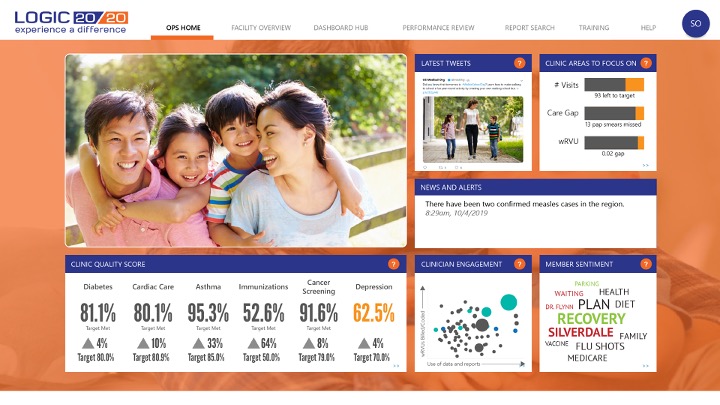
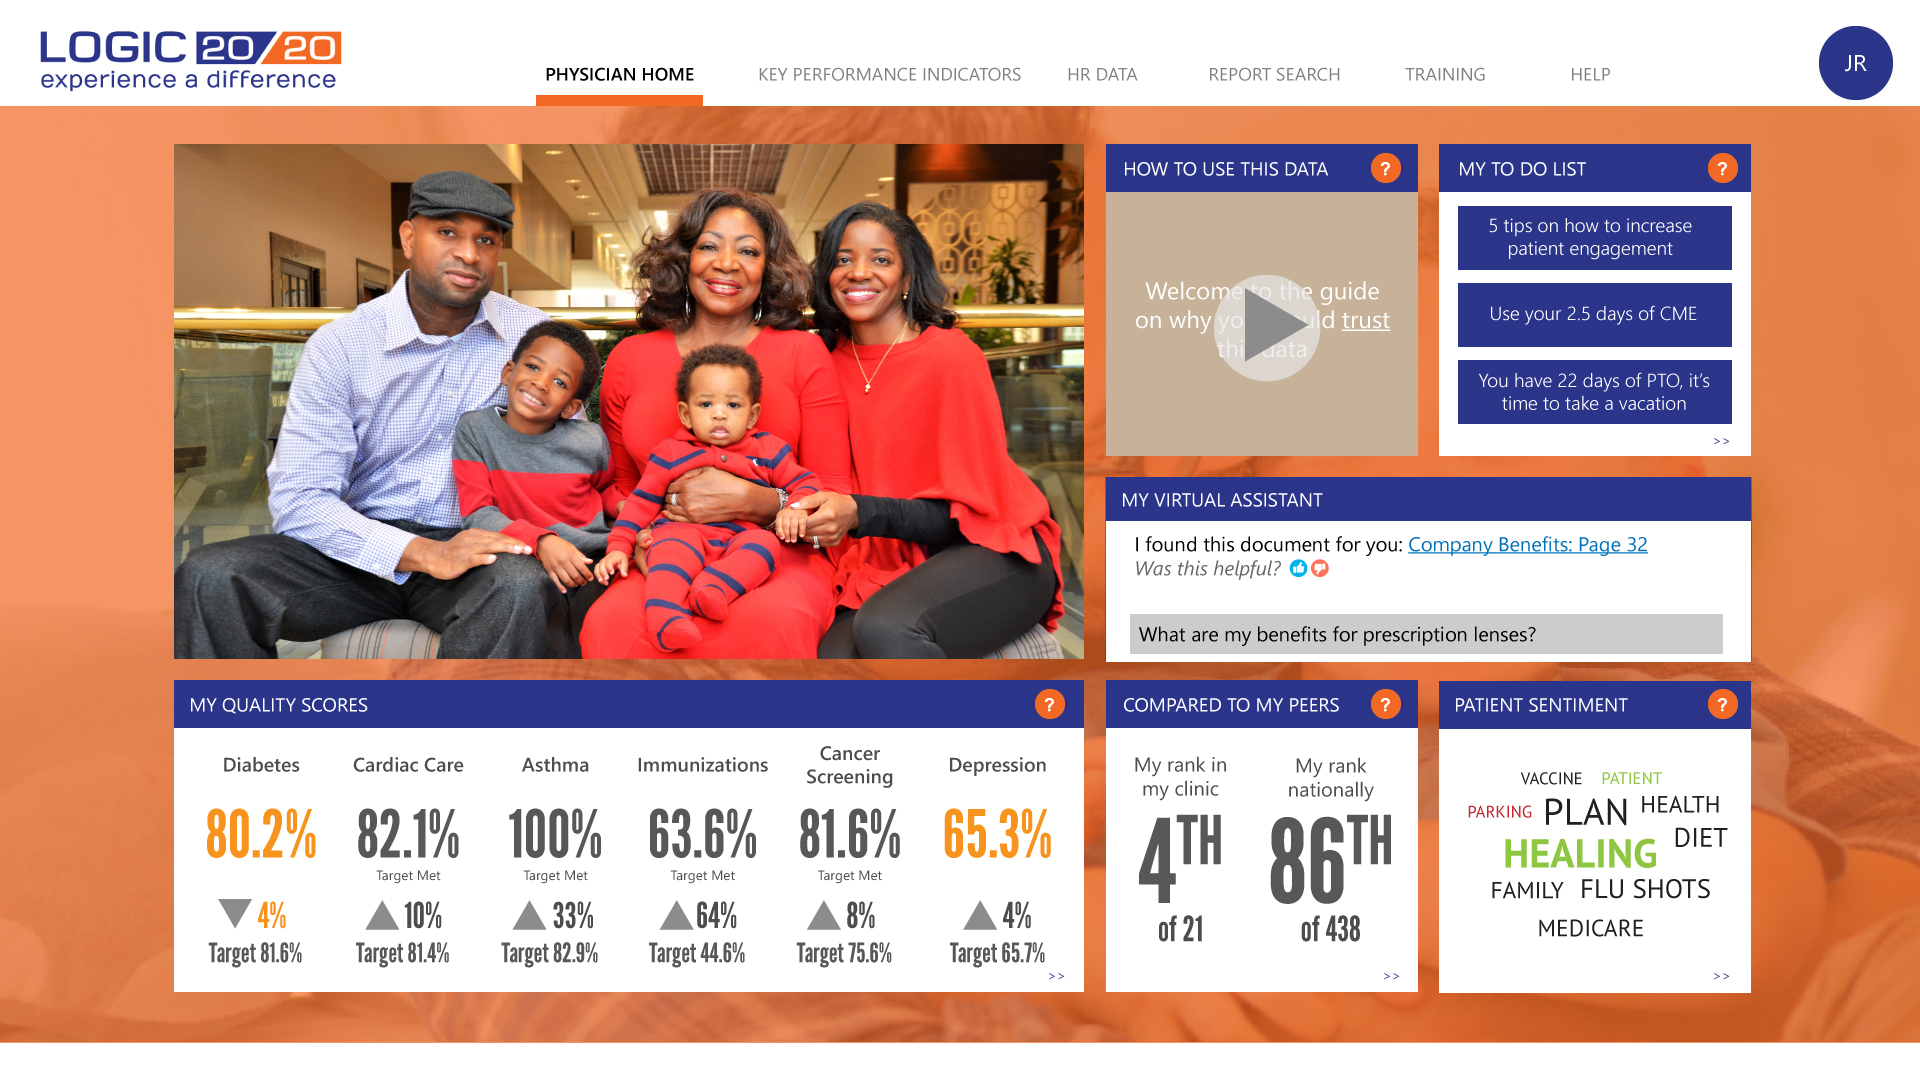
The hub we created offers views from existing dashboards in one location, plus tutorial videos and a virtual assistant to help users get the most out of their experience. With specialized home screens for each of the three levels, the platform offers each persona access to the analytics they need to make data-driven decisions, without making them wade through irrelevant information.

On the strategic level, executives can see KPIs for the system as a whole and drill down to specific regions and clinics.

On the operational level, physician leaders can track practice-specific quality scores for their clinics, areas that need attention, and other key performance indicators.

On the tactical level, physicians can see their own quality scores benchmarked against those of their peers and access specific reports, training resources, and more.
Instead of having to access multiple dashboards, our client’s decision makers can quickly access the information they need to make informed decisions, freeing up time to focus on their mission of serving patients.
Where to go from here
The physician experience and patient experience aren’t going to improve without new tools and processes. One recent Physician’s Foundation survey found that 91 percent of patients support their physicians having more control over the healthcare experience. An analytics portal is the first step in that direction.
During these trying times, an analytics portal can also provide another value to healthcare organizations: a sense of reliability and calm. The focus should be on people—patients, their doctors, and all others involved in making a great healthcare system. With an analytics portal, every member of a healthcare team saves time and energy, making room for closer attention, more praise, faster growth, and success.
Like what you see?

Nick Kelly is the Director of Visual Analytics at Logic20/20. He is a hands-on leader in analytics with over 16 years of international experience in analytics and software development, deployment, adoption, and user experience.

